How to Integrate Datatable with Highcharts
In the world of data visualization, the fusion of interactive tables and dynamic charts is a game-changer. When you combine the power of DataTables, a versatile jQuery plugin for creating interactive data tables, with Highcharts, a leading JavaScript library for building stunning charts and graphs, you unlock the potential to create data-driven web applications that engage and inform your audience like never before.
In this comprehensive guide, we will embark on a journey to explore the seamless integration of DataTables with Highcharts.
Whether you're a data enthusiast, a developer looking to enhance data presentation in your projects, or a business professional seeking to harness the full potential of your data, this article is crafted to provide you with a step-by-step roadmap, complete with practical code examples.
We'll delve into the rich capabilities of DataTables, where you can manipulate, search, and sort tabular data with ease. We'll also explore Highcharts' prowess in transforming data into visually appealing and interactive charts that tell compelling stories.
Together, these two tools will empower you to create data-driven dashboards and reports that offer both clarity and interactivity.
By the end of this tutorial, you'll have the skills to seamlessly integrate DataTables with Highcharts, allowing your users to explore and visualize data effortlessly.
Whether you're building financial dashboards, monitoring systems, or data analytics platforms, this guide is your gateway to creating web applications that turn raw data into actionable insights.
So, let's embark on this journey to bring the world of data tables and charts together.
By the time you finish reading, you'll have a newfound appreciation for the synergy between DataTables and Highcharts and how they can elevate your data visualization projects to new heights.
Ensure you have a web application or webpage where you want to integrate DataTable and Highcharts. Make sure you have included the necessary dependencies, including jQuery, DataTables, and Highcharts. You can include these libraries via CDNs or install them using npm or yarn.
https://cdn.datatables.net/1.13.6/css/jquery.dataTables.min.css
https://cdn.datatables.net/select/1.7.0/css/select.dataTables.min.css
//code.highcharts.com/css/highcharts.css

https://code.jquery.com/jquery-3.7.0.js
https://cdn.datatables.net/1.13.6/js/jquery.dataTables.min.js
https://cdn.datatables.net/select/1.7.0/js/dataTables.select.min.js
//code.highcharts.com/highcharts.js
Create a DataTable in your HTML. You can use DataTables to display and interact with your tabular data. For example.
<div id="demo-output" style="margin-bottom: 1em;" class="chart-display"></div>
    <table id="example" class="display" style="width:100%">
        <thead>
            <tr>
                <th>Name</th>
                <th>Position</th>
                <th>Office</th>
                <th>Age</th>
                <th>Start date</th>
                <th>Salary</th>
            </tr>
        </thead>
        <tbody>
            <tr>
                <td>Tiger Nixon</td>
                <td>System Architect</td>
                <td>Edinburgh</td>
                <td>61</td>
                <td>2011-04-25</td>
                <td>$320,800</td>
            </tr>
            <tr>
                <td>Garrett Winters</td>
                <td>Accountant</td>
                <td>Tokyo</td>
                <td>63</td>
                <td>2011-07-25</td>
                <td>$170,750</td>
            </tr>
            <tr>
                <td>Ashton Cox</td>
                <td>Junior Technical Author</td>
                <td>San Francisco</td>
                <td>66</td>
                <td>2009-01-12</td>
                <td>$86,000</td>
            </tr>
            <tr>
                <td>Dai Rios</td>
                <td>Personnel Lead</td>
                <td>Edinburgh</td>
                <td>35</td>
                <td>2012-09-26</td>
                <td>$217,500</td>
            </tr>
            <tr>
                <td>Jenette Caldwell</td>
                <td>Development Lead</td>
                <td>New York</td>
                <td>30</td>
                <td>2011-09-03</td>
                <td>$345,000</td>
            </tr>
            <tr>
                <td>Yuri Berry</td>
                <td>Chief Marketing Officer (CMO)</td>
                <td>New York</td>
                <td>40</td>
                <td>2009-06-25</td>
                <td>$675,000</td>
            </tr>
            <tr>
                <td>Gavin Joyce</td>
                <td>Developer</td>
                <td>Edinburgh</td>
                <td>42</td>
                <td>2010-12-22</td>
                <td>$92,575</td>
            </tr>
            <tr>
                <td>Jennifer Chang</td>
                <td>Regional Director</td>
                <td>Singapore</td>
                <td>28</td>
                <td>2010-11-14</td>
                <td>$357,650</td>
            </tr>
            <tr>
                <td>Shou Itou</td>
                <td>Regional Marketing</td>
                <td>Tokyo</td>
                <td>20</td>
                <td>2011-08-14</td>
                <td>$163,000</td>
            </tr>
            <tr>
                <td>Michelle House</td>
                <td>Integration Specialist</td>
                <td>Sydney</td>
                <td>37</td>
                <td>2011-06-02</td>
                <td>$95,400</td>
            </tr>
            <tr>
                <td>Suki Burks</td>
                <td>Developer</td>
                <td>London</td>
                <td>53</td>
                <td>2009-10-22</td>
                <td>$114,500</td>
            </tr>
            <tr>
                <td>Prescott Bartlett</td>
                <td>Technical Author</td>
                <td>London</td>
                <td>27</td>
                <td>2011-05-07</td>
                <td>$145,000</td>
            </tr>
            <tr>
                <td>Gavin Cortez</td>
                <td>Team Leader</td>
                <td>San Francisco</td>
                <td>22</td>
                <td>2008-10-26</td>
                <td>$235,500</td>
            </tr>
            <tr>
                <td>Hope Fuentes</td>
                <td>Secretary</td>
                <td>San Francisco</td>
                <td>41</td>
                <td>2010-02-12</td>
                <td>$109,850</td>
            </tr>
            <tr>
                <td>Vivian Harrell</td>
                <td>Financial Controller</td>
                <td>San Francisco</td>
                <td>62</td>
                <td>2009-02-14</td>
                <td>$452,500</td>
            </tr>
            <tr>
                <td>Timothy Mooney</td>
                <td>Office Manager</td>
                <td>London</td>
                <td>37</td>
                <td>2008-12-11</td>
                <td>$136,200</td>
            </tr>
            <tr>
                <td>Jackson Bradshaw</td>
                <td>Director</td>
                <td>New York</td>
                <td>65</td>
                <td>2008-09-26</td>
                <td>$645,750</td>
            </tr>
            <tr>
                <td>Finn Camacho</td>
                <td>Support Engineer</td>
                <td>San Francisco</td>
                <td>47</td>
                <td>2009-07-07</td>
                <td>$87,500</td>
            </tr>
            <tr>
                <td>Serge Baldwin</td>
                <td>Data Coordinator</td>
                <td>Singapore</td>
                <td>64</td>
                <td>2012-04-09</td>
                <td>$138,575</td>
            </tr>
            <tr>
                <td>Zenaida Frank</td>
                <td>Software Engineer</td>
                <td>New York</td>
                <td>63</td>
                <td>2010-01-04</td>
                <td>$125,250</td>
            </tr>
            <tr>
                <td>Zorita Serrano</td>
                <td>Software Engineer</td>
                <td>San Francisco</td>
                <td>56</td>
                <td>2012-06-01</td>
                <td>$115,000</td>
            </tr>
        </tbody>
        <tfoot>
            <tr>
                <th>Name</th>
                <th>Position</th>
                <th>Office</th>
                <th>Age</th>
                <th>Start date</th>
                <th>Salary</th>
            </tr>
        </tfoot>
    </table>
In a script tag or an external JavaScript file, initialize the DataTable on your table. You can do this by targeting the table's ID.
<script>
    // Create DataTable
const table = new DataTable('#example');

// Create chart
const chart = Highcharts.chart('demo-output', {
    chart: {
        type: 'pie',
        styledMode: true
    },
    title: {
        text: 'Staff Count Per Position'
    },
    series: [
        {
            data: chartData(table)
        }
    ]
});

// On each draw, update the data in the chart
table.on('draw', function () {
    chart.series[0].setData(chartData(table));
});

function chartData(table) {
    var counts = {};

    // Count the number of entries for each position
    table
        .column(1, { search: 'applied' })
        .data()
        .each(function (val) {
            if (counts[val]) {
                counts[val] += 1;
            }
            else {
                counts[val] = 1;
            }
        });

    return Object.entries(counts).map((e) => ({
        name: e[0],
        y: e[1]
    }));
}
</script>
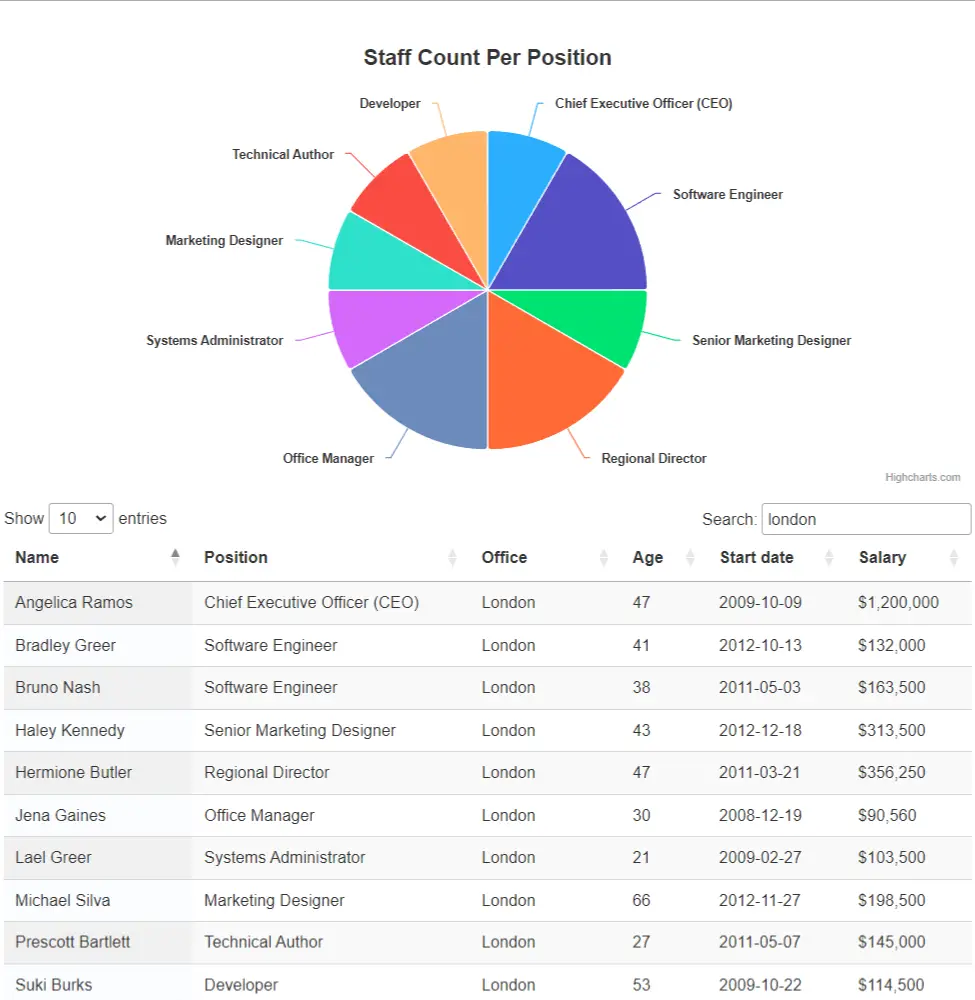
Output:
You might also like:
- Read Also: How to Add Bootstrap 5 Datatable Example
- Read Also: Datatable Server Side Custom Search/Filter In Laravel
- Read Also: Laravel 8 Highcharts Example Tutorial
- Read Also: How To Create Dynamic Pie Chart In Laravel 8


