Laravel 8 Google Pie Chart Example
In this article, we will see laravel 8 google pie chart example. google charts use to visualize data on your website. here we will see a pie chart example in laravel 8. A pie chart is a circular statistical graphic, which is divided into slices to illustrate numerical proportion.
So, let's see the dynamic google pie chart In laravel 8, how to use google pie chart in laravel 8, pie chart example in laravel 8.
Step 1 : Install Laravel 8
Step 2 : Create Migration
Step 3 : Add Route
Step 4 : Create Controller and Model
Step 5 : Create Blade File
Install new project in your laravel application for laravel 8 google pie chart example.
composer create-project --prefer-dist laravel/laravel laravel_8_google_piechart
We are getting dynamic data for the piechart example. So first, we need to create migration for the "product" table using laravel PHP artisan command.
php artisan make:migration create_products_table --create=products
After running this command you will find the file in this location "database/migrations/" in this file you need to add the below code for the google pie chart In laravel 8.
<?php

use Illuminate\Database\Migrations\Migration;
use Illuminate\Database\Schema\Blueprint;
use Illuminate\Support\Facades\Schema;

class CreateProductsTable extends Migration
{
    public function up()
    {
        Schema::create('products', function (Blueprint $table) {
            $table->id();
            $table->string('name')->nullable();
            $table->integer('price')->nullable();
            $table->integer('year')->nullable();
            $table->string('product_type')->nullable();
            $table->timestamps();
        });
    }
    public function down()
    {
        Schema::dropIfExists('products');
    }
}
after this we need to run this migration by the following command in our terminal:
php artisan migrate
And after migration, you need to add some records to the database
Now add a route in the Routes/web.php file.
Route::get('piechart', 'PiechartController@piechart');
After adding the route we need to create a new controller and model for the google piechart example. So, type the below command in your terminal to create a controller.
php artisan make:controller PiechartController
php artisan make:model Product
Now add the below code in your PiechartController.
<?php

namespace App\Http\Controllers;

use Illuminate\Http\Request;
use App\Product;

class PiechartController extends Controller
{
    public function piechart(Request $request)
    {
    	$phone_count_18 = Product::where('product_type','phone')->where('year','2018')->get()->count();
    	$phone_count_19 = Product::where('product_type','phone')->where('year','2019')->get()->count();
    	$phone_count_20 = Product::where('product_type','phone')->where('year','2020')->get()->count();

    	$laptop_count_18 = Product::where('product_type','laptop')->where('year','2018')->get()->count();
    	$laptop_count_19 = Product::where('product_type','laptop')->where('year','2019')->get()->count();
    	$laptop_count_20 = Product::where('product_type','laptop')->where('year','2020')->get()->count();

    	$tablet_count_18 = Product::where('product_type','tablet')->where('year','2018')->get()->count();
    	$tablet_count_19 = Product::where('product_type','tablet')->where('year','2019')->get()->count();
    	$tablet_count_20 = Product::where('product_type','tablet')->where('year','2020')->get()->count();

    	return view('piechart',compact('phone_count_18','phone_count_19','phone_count_20','laptop_count_18','laptop_count_19','laptop_count_20','tablet_count_18','tablet_count_19','tablet_count_20'));
    }
}
At last, we are creating a blade file for view output of the pie chart example in laravel, So copy the below code in your piechart.blade.php file.
<html>
<head>
    <title>Laravel 8 Google Pie Chart Example - Techsolutionstuff</title>
    <script type="text/javascript" src="https://www.gstatic.com/charts/loader.js"></script>
</head>
<body>
    <h2 style="margin:50px 0px 0px 0px;text-align: center;">Laravel 8 Google Pie Chart Tutorial - Techsolutionstuff</h2>
    <div id="piechart" style="width: 900px; height: 500px; margin-left: 235px"></div>
    <script type="text/javascript">
        var phone_count_18 = <?php echo $phone_count_18; ?>;
        var phone_count_19 = <?php echo $phone_count_19; ?>;
        var phone_count_20 = <?php echo $phone_count_20; ?>;

        var laptop_count_18 = <?php echo $laptop_count_18; ?>;
        var laptop_count_19 = <?php echo $laptop_count_19; ?>;
        var laptop_count_20 = <?php echo $laptop_count_20; ?>;

        var tablet_count_18 = <?php echo $tablet_count_18; ?>;
        var tablet_count_19 = <?php echo $tablet_count_19; ?>;
        var tablet_count_20 = <?php echo $tablet_count_20; ?>;

        google.charts.load('current', {'packages':['corechart']});
        google.charts.setOnLoadCallback(drawChart);
        function drawChart() {
             var data = google.visualization.arrayToDataTable([
          ['Year', 'Phone', 'Laptop', 'Tablet'],
          ['2018',  phone_count_18, laptop_count_18, tablet_count_18],
          ['2019',  phone_count_19, laptop_count_19, tablet_count_19],
          ['2020',  phone_count_20, laptop_count_20, tablet_count_20]
        ]);
            var options = {
                curveType: 'function',
                legend: { position: 'bottom' }
            };
            var chart = new google.visualization.PieChart(document.getElementById('piechart'));
            chart.draw(data, options);
        }
    </script>
</body>
</html>
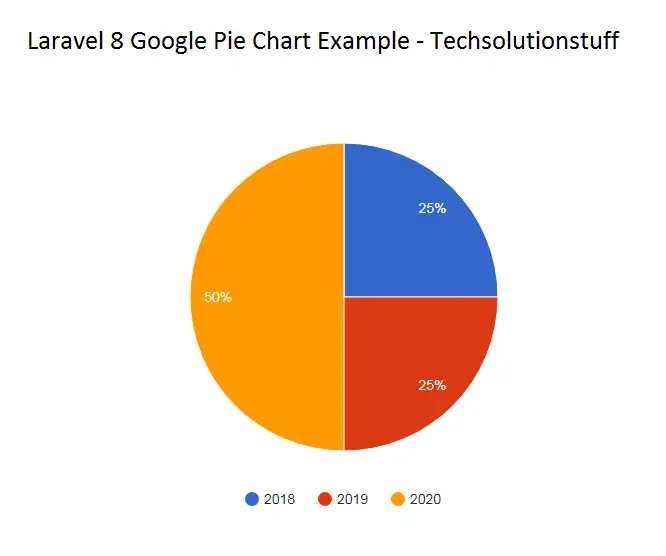
After implementing the above steps you will get the output of the laravel 8 google pie chart tutorial like the below image.
You might also like :
- Read Also : Export Buttons In Datatable
- Read Also : Laravel REST API CRUD Tutorial
- Read Also : Laravel 8 CRUD Operation Example
- Read Also : How To Get Current User Location In Laravel


