Google Line Chart Example in Laravel 8
In this article, we will see a google line chart example in laravel 8. Google charts use to visualize data on your website. Here we will see the line chart example or google chart in laravel 8. A line chart can also be used to compare changes over the same period of time for more than one group. So, here we will learn how to use google chart in laravel 8.
So, lets' see laravel 8 google line chart tutorial, how to use google chart in laravel 8, google chart in laravel 8, google charts example.
Step 1 : Install Laravel 8
Step 2 : Create Migration
Step 3 : Add Route
Step 4 : Create Controller and Model
Step 5 : Create Blade File and Add Google Line Chart
Install new project in your laravel application for google line chart tutorial.
composer create-project --prefer-dist laravel/laravel google_linechart
We are getting dynamic data for the line chart example. So, first we need to create migration for the "product" table using laravel php artisan command.
php artisan make:migration create_products_table --create=products
After running this command you will find php file in this location "database/migrations/" in this file you need to add the below code.
<?php

use Illuminate\Database\Migrations\Migration;
use Illuminate\Database\Schema\Blueprint;
use Illuminate\Support\Facades\Schema;

class CreateProductsTable extends Migration
{
    public function up()
    {
        Schema::create('products', function (Blueprint $table) {
            $table->id();
            $table->string('name')->nullable();
            $table->integer('price')->nullable();
            $table->integer('year')->nullable();
            $table->string('product_type')->nullable();
            $table->timestamps();
        });
    }
    public function down()
    {
        Schema::dropIfExists('products');
    }
}
after this we need to run this migration by the following command in our terminal:
php artisan migrate
And after migration, you need to add some records as per the below screen print.
Now add a route in the Routes/web.php file.
Route::get('linechart', 'LinechartController@linechart');
After adding the route we need to create a new controller and model for the google line chart example. So, type the below command in your terminal to create the controller.
php artisan make:controller LinechartController
php artisan make:model Product
Now add the below code in your linechartcontroller.
<?php

namespace App\Http\Controllers;

use Illuminate\Http\Request;
use App\Product;

class LinechartController extends Controller
{
    public function linechart(Request $request)
    {
    	$phone_count_18 = Product::where('product_type','phone')->where('year','2018')->get()->count();
    	$phone_count_19 = Product::where('product_type','phone')->where('year','2019')->get()->count();
    	$phone_count_20 = Product::where('product_type','phone')->where('year','2020')->get()->count();

    	$laptop_count_18 = Product::where('product_type','laptop')->where('year','2018')->get()->count();
    	$laptop_count_19 = Product::where('product_type','laptop')->where('year','2019')->get()->count();
    	$laptop_count_20 = Product::where('product_type','laptop')->where('year','2020')->get()->count();

    	$tablet_count_18 = Product::where('product_type','tablet')->where('year','2018')->get()->count();
    	$tablet_count_19 = Product::where('product_type','tablet')->where('year','2019')->get()->count();
    	$tablet_count_20 = Product::where('product_type','tablet')->where('year','2020')->get()->count();

    	return view('linechart',compact('phone_count_18','phone_count_19','phone_count_20','laptop_count_18','laptop_count_19','laptop_count_20','tablet_count_18','tablet_count_19','tablet_count_20'));
    }
}
In last we are creating a blade file for viewing the output of the line chart. So, copy the below code in your linechart.blade.php file.
<html>
<head>
    <title>Laravel 8 Google Line Chart Tutorial - Techsolutionstuff</title>
    <script type="text/javascript" src="https://www.gstatic.com/charts/loader.js"></script>
</head>
<body>
    <h2 style="margin:50px 0px 0px 0px;text-align: center;">Laravel 8 Google Line Chart Tutorial - Techsolutionstuff</h2>
    <div id="linechart" style="width: 900px; height: 500px; margin-left: 235px"></div>
    <script type="text/javascript">
        var phone_count_18 = <?php echo $phone_count_18; ?>;
        var phone_count_19 = <?php echo $phone_count_19; ?>;
        var phone_count_20 = <?php echo $phone_count_20; ?>;

        var laptop_count_18 = <?php echo $laptop_count_18; ?>;
        var laptop_count_19 = <?php echo $laptop_count_19; ?>;
        var laptop_count_20 = <?php echo $laptop_count_20; ?>;

        var tablet_count_18 = <?php echo $tablet_count_18; ?>;
        var tablet_count_19 = <?php echo $tablet_count_19; ?>;
        var tablet_count_20 = <?php echo $tablet_count_20; ?>;

        google.charts.load('current', {'packages':['corechart']});
        google.charts.setOnLoadCallback(drawChart);
        function drawChart() {
             var data = google.visualization.arrayToDataTable([
          ['Year', 'Phone', 'Laptop', 'Tablet'],
          ['2018',  phone_count_18, laptop_count_18, tablet_count_18],
          ['2019',  phone_count_19, laptop_count_19, tablet_count_19],
          ['2020',  phone_count_20, laptop_count_20, tablet_count_20]
        ]);
            var options = {
                curveType: 'function',
                legend: { position: 'bottom' }
            };
            var chart = new google.visualization.LineChart(document.getElementById('linechart'));
            chart.draw(data, options);
        }
    </script>
</body>
</html>
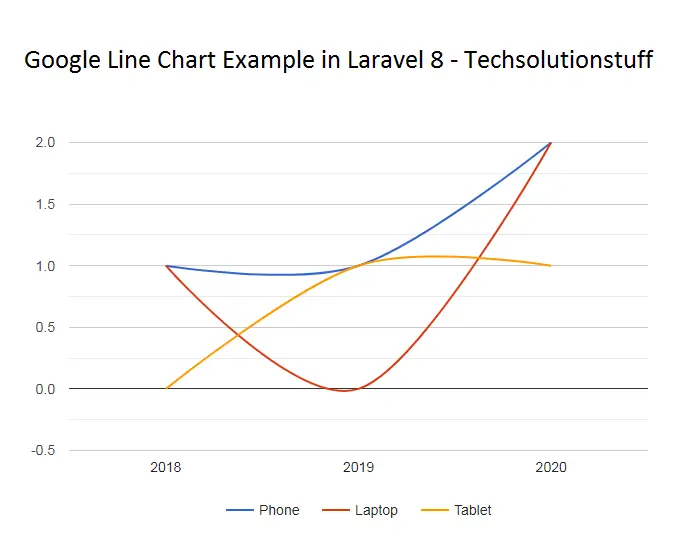
After implementing these steps you will get the output of the laravel 8 google line chart tutorial like the below image.
You might also like :
- Read Also : Laravel REST API CRUD Tutorial
- Read Also : Import Export CSV/EXCEL File In Laravel
- Read Also : How To Add Summernote Editor In Laravel 8
- Read Also : How To Integrate Paypal Payment Gateway In Laravel 8


