How To Create Tailwind CSS Pie Chart
As a developer seeking to enhance my web application with visually appealing and informative data visualizations, I understand the importance of effective data presentation. Pie charts have long been recognized as a popular choice for displaying data proportions and percentages in a visually intuitive manner.
With their circular shape and segmented slices, pie charts allow users to grasp data distribution at a glance. That's why I turned to Tailwind CSS to create stunning and customizable pie charts.
Tailwind CSS, a utility-first CSS framework, offers an extensive collection of pre-built classes and styles that make designing and implementing pie charts a breeze.
Its flexible and user-friendly approach empowers developers like me to effortlessly create captivating and interactive data visualizations.
In this article, I will guide you through a step-by-step process of creating pie charts using Tailwind CSS. By mastering this technique, you too can transform raw data into visually compelling and informative pie charts that elevate the data visualization capabilities of your web application.
Whether you're showcasing sales figures, analyzing survey results, or presenting any other form of data distribution, learning how to create pie charts with Tailwind CSS will equip you with the skills to captivate your audience with engaging visual representations.
So, let's delve into the world of Tailwind CSS and unlock the power to create mesmerizing and fully customizable pie charts that will take your data visualization game to the next level.
Here's a step-by-step guide on creating a pie chart using Tailwind CSS:
Prerequisites:
To follow along with this tutorial, it is recommended to have a basic understanding of HTML, CSS, and JavaScript. Familiarity with Tailwind CSS and setting up a project using npm or a similar package manager will be helpful.
Before we begin creating bar charts, ensure that you have a Tailwind CSS project set up. You can refer to the official Tailwind CSS documentation or choose your preferred method to set up the project. Once your project is ready, we can move on to the next step.
To create pie charts, we will utilize a charting library called Chart.js. Chart.js is a flexible and user-friendly library that supports various types of charts, including pie charts. Start by installing Chart.js using npm or by including it directly from a CDN.
Start by creating the HTML structure that will hold the pie chart. You'll need a canvas element where the chart will be rendered.
<canvas id="pieChart"></canvas>
In your JavaScript file, import Chart.js and initialize a new pie chart using the canvas element's ID.
const pieChartElement = document.getElementById('pieChart');
const pieChart = new Chart(pieChartElement, {
  type: 'pie',
  data: {
    // Add data and labels here
  },
  options: {
    // Configure chart options here
  },
});
Within the chart configuration data property, provide the necessary data and labels for your pie chart. The data should be an array of values, and the labels should be an array of corresponding labels for each data point.
data: {
  labels: ['Monday', 'Tuesday', 'Wednesday', 'Thursday', 'Friday', 'Saturday', 'Sunday '],
  datasets: [
    {
      label: 'Data',
      data: [2112, 2343, 2545, 3423, 2365, 1985, 987],
    },
  ],
},
Tailwind CSS allows you to easily customize the appearance of your pie chart. Utilize Tailwind CSS utility classes to modify the chart's colors, labels, axes, and more. Refer to the Tailwind CSS documentation for an extensive list of available classes.
Example:
<!DOCTYPE html>
<html lang="en">
  <head>
    <meta charset="UTF-8" />
    <meta http-equiv="X-UA-Compatible" content="IE=edge" />
    <meta name="viewport" content="width=device-width, initial-scale=1.0" />
    <title>Tailwind CSS Pie Chart Example - Techsolutionstuff </title>
    <script src="https://cdn.tailwindcss.com"></script>
  </head>

  <body>
    <div class="container mx-auto p-60">
      <div class="overflow-hidden rounded-lg shadow-md">
        <div class="px-5 py-3 bg-stone-300">
          <h5 class="font-bold text-stone-600">
            How To Create Tailwind CSS Pie Chart - Techsolutionstuff
          </h5>
        </div>
        <canvas class="p-6" id="pieChart"></canvas>
      </div>
    </div>
    <script src="https://cdnjs.cloudflare.com/ajax/libs/Chart.js/3.9.1/chart.min.js"
      integrity="sha512-ElRFoEQdI5Ht6kZvyzXhYG9NqjtkmlkfYk0wr6wHxU9JEHakS7UJZNeml5ALk+8IKlU6jDgMabC3vkumRokgJA=="
      crossorigin="anonymous" referrerpolicy="no-referrer"></script>
    <script>
      const labels = ['Monday', 'Tuesday', 'Wednesday', 'Thursday', 'Friday', 'Saturday', 'Sunday '];
      const data = {
        labels: labels,
        datasets: [
          {
            label: 'Traffic',
        		data: [2112, 2343, 2545, 3423, 2365, 1985, 987],
				backgroundColor: [
					'rgba(63, 81, 181, 0.5)',
					'rgba(77, 182, 172, 0.5)',
					'rgba(66, 133, 244, 0.5)',
					'rgba(156, 39, 176, 0.5)',
					'rgba(233, 30, 99, 0.5)',
					'rgba(66, 73, 244, 0.4)',
					'rgba(66, 133, 244, 0.2)',
				],
          },
        ],
      };

      const configChart = {
        type: "pie",
        data,
        options: {},
      };

      var chartLine = new Chart(
        document.getElementById("pieChart"),
        configChart
      );
    </script>
  </body>
</html>
In this article, we have explored the process of creating a pie chart using the powerful combination of Tailwind CSS and Chart.js.
By following the step-by-step guide and leveraging the flexibility of these two technologies, you can now easily incorporate visually stunning and interactive pie charts into your web applications.
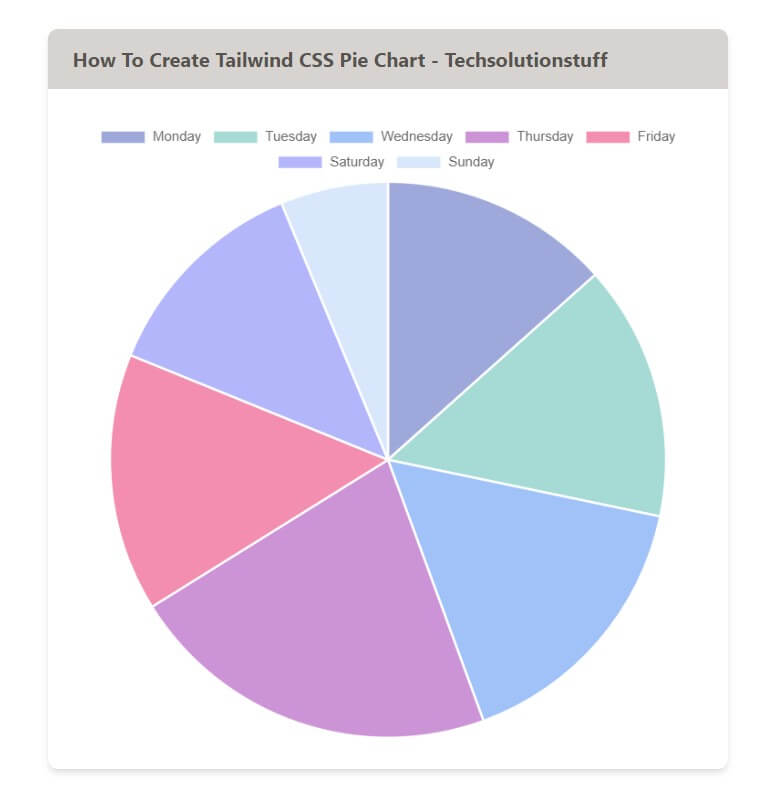
Output:
You might also like:
- Read Also: Laravel REST API CRUD Tutorial
- Read Also: Dynamic Pie Chart Example In Laravel 9
- Read Also: Laravel 8 Google Pie Chart Example
- Read Also: How To Get Current Date And Time In Node.js


