How To Create Dynamic Bar Chart In Laravel
In this post we will see how to create dynamic bar chart in laravel. Here, we will create product model for bar chart example or bar chart in laravel, we have show all steps for dynamic bar chart example as below, so,let's see how to create dynamic bar chart in laravel.
Step 1 : Install Laravel for Dynamic Bar Chart Example
Step 2 : Add Migration and Route
Step 3 : Add Route
Step 4 : Create Controller And Model
Step 5 : Create Blade File for Dynamic Bar Chart Example
Run below command in terminal to create new project in laravel.
composer create-project --prefer-dist laravel/laravel barchart
Here, we required dynamic data for bar chart example so, we will create migration for "product" table using laravel php artisan command.
php artisan make:migration create_products_table --create=products
Now, make changes in migration file in this location "database/migrations".
<?php

use Illuminate\Database\Migrations\Migration;
use Illuminate\Database\Schema\Blueprint;
use Illuminate\Support\Facades\Schema;

class CreateProductTable extends Migration
{
    /**
     * Run the migrations.
     *
     * @return void
     */
    public function up()
    {
        Schema::create('product', function (Blueprint $table) {
            $table->id();
            $table->string('name')->nullable();
            $table->integer('price')->nullable();
            $table->integer('year')->nullable();
            $table->string('product_type')->nullable();
            $table->timestamps();
        });
    }

    /**
     * Reverse the migrations.
     *
     * @return void
     */
    public function down()
    {
        Schema::dropIfExists('product');
    }
}
Now, run this migration using below command.
php artisan migrate
Now, ceate route in routes/web.php
Route::get('barchart', 'BarchartController@barchart');
After adding route we need to create new conroller and model so type below command for create controller.
use App\Http\Controllers\Admin\BarchartController;

Route::get('barchart', [BarchartController::class,'barchart']);
php artisan make:model Product
Add below code in your controller.
<?php

namespace App\Http\Controllers;

use Illuminate\Http\Request;
use App\Product;

class BarchartController extends Controller
{
    public function barchart(Request $request)
    {
    	$fruit = Product::where('product_type','fruit')->get();
    	$veg = Product::where('product_type','vegitable')->get();
    	$grains = Product::where('product_type','grains')->get();
    	$fruit_count = count($fruit);
    	$veg_count = count($veg);
    	$grains_count = count($grains);

    	return view('barchart',compact('fruit_count','veg_count','grains_count'));
    }
}
Now,creating barchart.blade.php file for view.
<!DOCTYPE html>
<html>
<head>
	<meta charset="utf-8">
	<meta http-equiv="X-UA-Compatible" content="IE=edge">
	<title>How To Create Dynamic Bar Chart In Laravel - techsolutionstuff.com</title>
	<link rel="stylesheet" href="https://maxcdn.bootstrapcdn.com/bootstrap/3.3.7/css/bootstrap.min.css">
	<link href="{{asset('assets/css/components.min.css')}}" rel="stylesheet" type="text/css">
	<script type="text/javascript" src="{{asset('assets/js/jquery.min.js')}}"></script>
	<script type="text/javascript" src="{{asset('assets/js/bootstrap.bundle.min.js')}}"></script>
	<script type="text/javascript" src="{{asset('assets/js/echarts.min.js')}}"></script>

</head>
<body>
<div class="col-md-12">
	<h1 class="text-center">How To Create Dynamic Bar Chart In Laravel - techsolutionstuff.com </h1>
    <div class="col-md-8 col-md-offset-2">
    	<div class="col-xl-6">
    		<div class="card">
    			<div class="card-body">
    				<div class="chart-container">
    					<div class="chart has-fixed-height" id="bars_basic"></div>
    				</div>
    			</div>
    		</div>
    	</div>
    </div>
</div>
</body>
</html>

<script type="text/javascript">
var bars_basic_element = document.getElementById('bars_basic');
if (bars_basic_element) {
    var bars_basic = echarts.init(bars_basic_element);
    bars_basic.setOption({
        color: ['#3398DB'],
        tooltip: {
            trigger: 'axis',
            axisPointer: {
                type: 'shadow'
            }
        },
        grid: {
            left: '3%',
            right: '4%',
            bottom: '3%',
            containLabel: true
        },
        xAxis: [
            {
                type: 'category',
                data: ['Fruit', 'Vegitable','Grains'],
                axisTick: {
                    alignWithLabel: true
                }
            }
        ],
        yAxis: [
            {
                type: 'value'
            }
        ],
        series: [
            {
                name: 'Total Products',
                type: 'bar',
                barWidth: '20%',
                data: [
                    {{$fruit_count}},
                    {{$veg_count}},
                    {{$grains_count}}
                ]
            }
        ]
    });
}
</script>
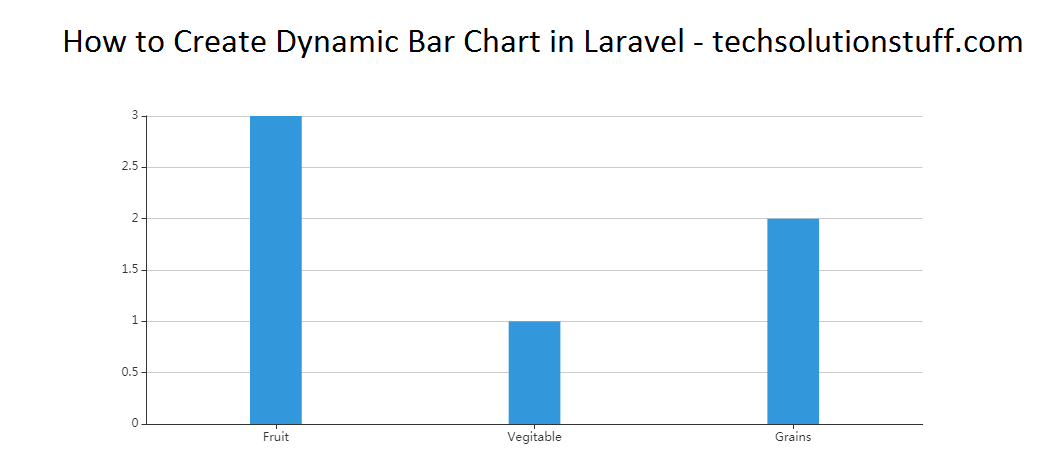
So, We are done with our code and you can see output as below screen print.
You may also Like :
- Read Also : How To Get Selected Checkbox List Value In Jquery
- Read Also : How To Create Dynamic Pie Chart In Laravel
- Read Also : Laravel 8 Google Recaptcha Example
- Read Also : Laravel AJAX CRUD Example Tutorial


